This is a guest post by Rachel Rodman.
———————
The foods we eat – namely fruits, vegetables, and grains – are all products of their own evolutionary stories. Some of the most well-known chapters in these stories are the most recent ones – dramatic changes in size and shape mediated by human selection.
One especially striking example is that of Brassica oleracea –the source of broccoli, cauliflower, kale, Brussels sprouts, kohlrabi, and cabbage. Each of these diverse vegetables belongs to the same species, and each is the product of a different kind of selection, exerted on different descendants of a common ancestor.
Corn is another famous chapter. The derivation of corn – with its thick cobs and juicy kernels developed from the ancestral grain teosinte, which it barely resembles – has been described as “arguably man’s first, and perhaps his greatest, feat of genetic engineering.”
But these, again, are recent chapters. Relatively. They unfolded over the course of consecutive human lifetimes –hundreds of years or thousands at the outset (sometimes much less). They are the final flourishes (for the moment) on a much older story — a story that significantly precedes agriculture as well as humans.
It is this older story that lies at the heart of truly deep differences, like those at play in the idiom “apples and oranges.” The contrast between these two fruits can be mapped according to many measures: taste, smell, texture, visual appearance, and so on. When used colloquially, the phrase serves as a proxy for unmanageable difference — to describe categories that differ along so many axes that they can no longer be meaningfully compared.
However, in evolutionary terms, the difference between apples and oranges is not ineffable. It is not a folksy aphorism or a Zen puzzle at which to throw up one’s hands. To the contrary, it can be temporalized and quantified; or at least estimated. In fact, in evolutionary terms, that difference comes down to about 100 million years. That is, at least, the date (give or take) when the last common ancestor of apples and oranges lived — a flowering plant from the mid-Cretaceous.
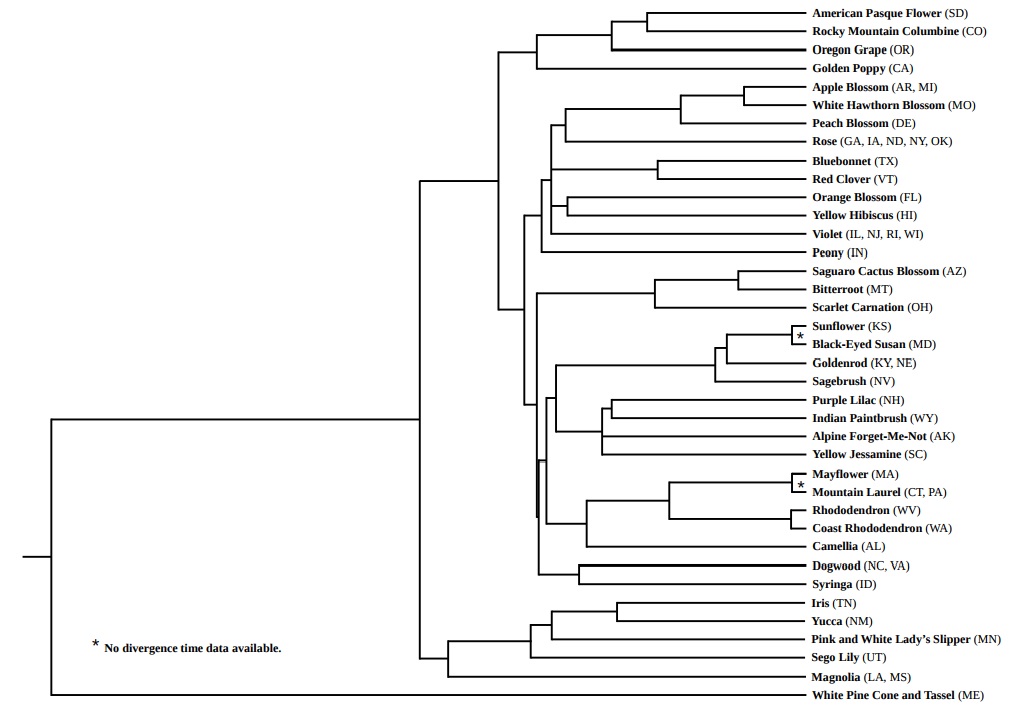
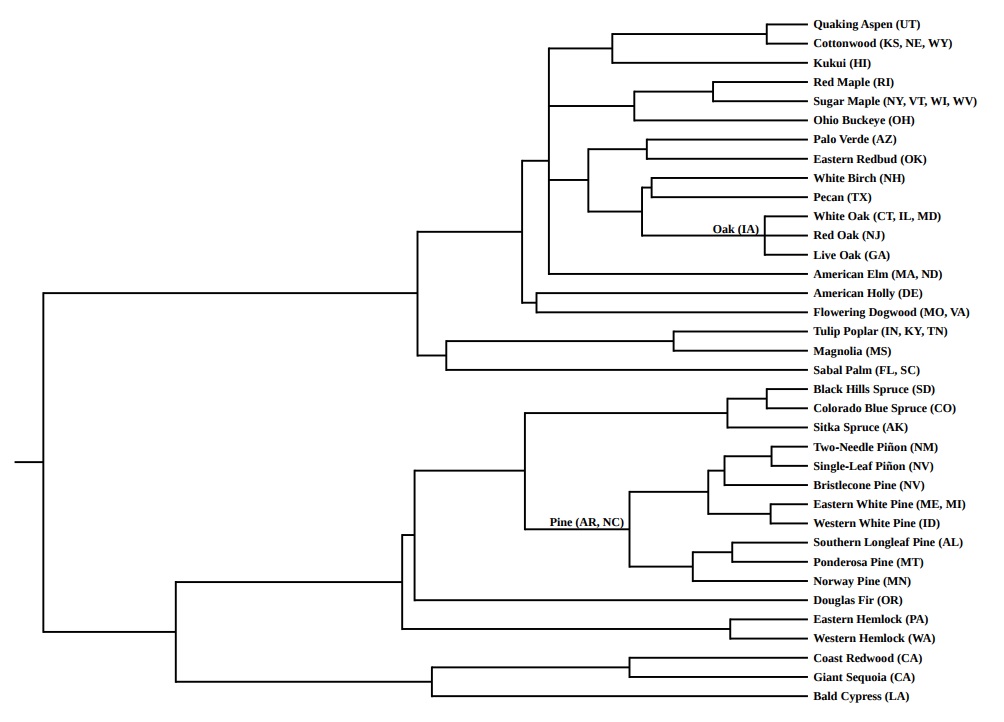
The best way to represent these deep stories is with a diagram called a phylogenetic tree. In a phylogenetic tree, each species is assigned its own line, and each of these lines is called a branch. Points at which two branches intersect represent the common ancestor of the species assigned to these branches.
Phylogenetic trees can serve many purposes. Their classical function is to communicate a hypothesis – a pattern of familial relationships supported by a particular set of data based on DNA sequence, fossils, or the physical characteristics of living organisms.
But here are two alternate reasons to build trees:
- To inspire wonder
- Or (my favorite) just because
To reflect these additional motivations – this conviction that trees are for everyone and for all occasions and that an evolutionary tree belongs on every street corner – when I build trees, I often avail myself of a range of non-traditional materials. I’ve written previously about creating edible trees using cake frosting and fruit, as well as building trees out of state symbols and popular songs. Now here are two additional building materials, which are arguably even more fun.
First: Stickers. This one is titled: “Like Apples and Oranges…and Bananas.”
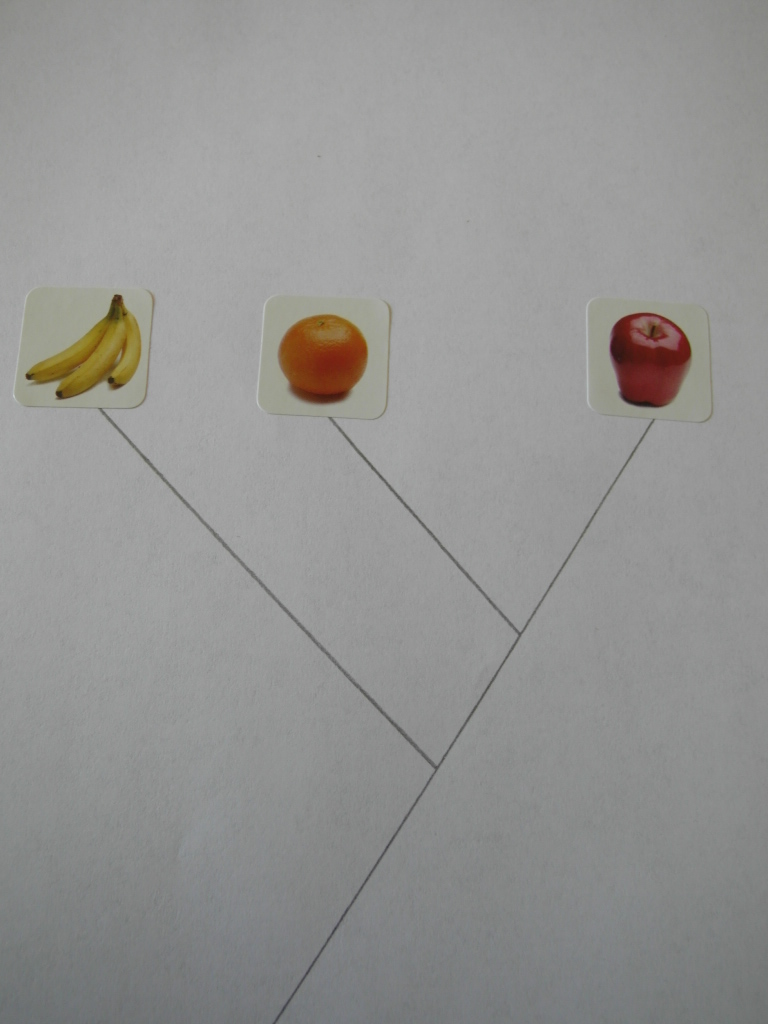
Bananas split ways with the common ancestor of apples and oranges about 150 million years ago, 50 million years before the split between apples and oranges. On this tree, these relationships are represented like so: the banana branch diverges from the apple branch at a deeper position on the trunk, and the orange branch diverges from the apple branch at a shallower position.
All of the data required to build this tree (and essentially any tree) is available at TimeTree.org. On TimeTree, select “Get Divergence Time For a Pair of Taxa” at the top of the page. This is where one can obtain a divergence time estimate for most pairs of species. The divergence time is an approximate date, millions of years ago, at which the organisms’ last common ancestors may have lived. For more heavy duty assistance, there is the “Load a List of Species” option at the bottom of the page. Here, one can upload a list of species names (.txt), and TimeTree will generate a complete tree – a schematic that can serve as a guide in patterning one’s own phylogenetic artwork.
Here, by way of additional illustration, are three more sticker trees, equally charming and equally mouthwatering:
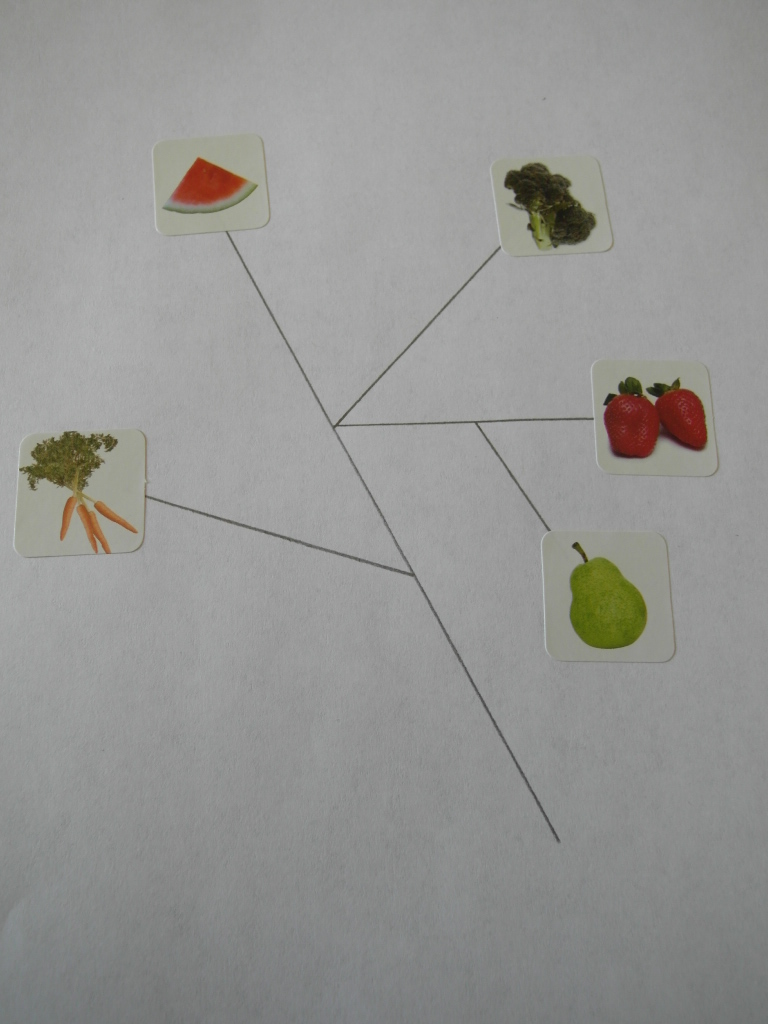
Carrot, watermelon, broccoli, strawberry, and pear.
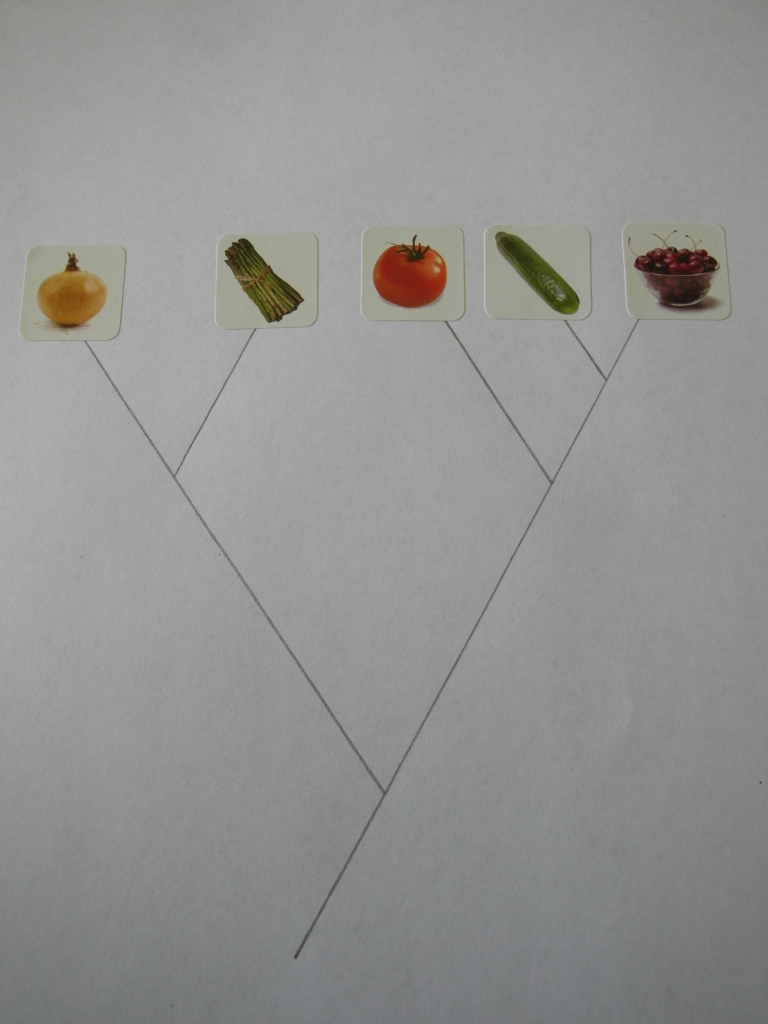
Onion, asparagus, tomato, cucumber, and cherry.
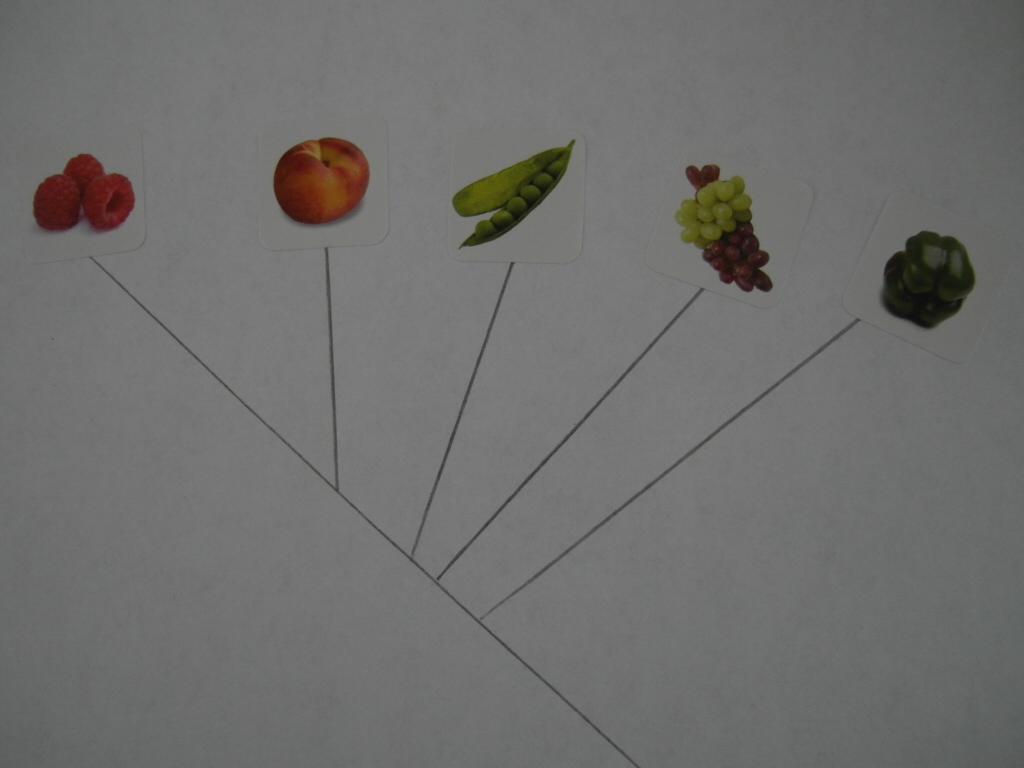
Raspberry, apricot, pea, grape, and green pepper.
Sticker trees are festive takes on traditional trees. They are brighter, livelier, and more lovely. But, like traditional trees, they are also 2D, restricted to a flat sheet of paper. To extend one’s phylogenetic art projects into three dimensions, one must modify the choice of materials. There are many options. The following 3D tree, for example, employs 13 pieces of plastic toy food, the accouterments of a typical play kitchen. Segments of yarn serve as branches.
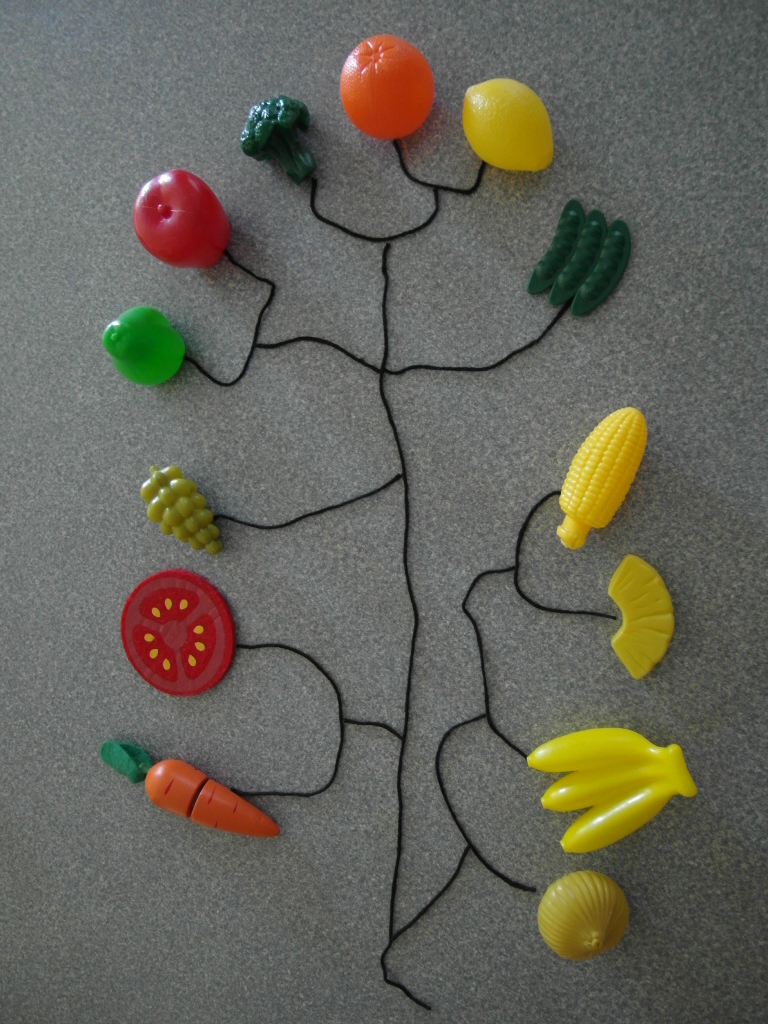
Trees like these, made of stickers or toys, constitute playful takes on deep questions. In pencil and yarn, they sketch a network of primeval relationships. They tell the history of our foods, a narrative whose origins profoundly precede us, as well as our intention to selectively breed them. To the Way-Before, to the Way-Way-Way-Before, these projects give shape and color. If and where they succeed, it is because they manage to do two things at once: To communicate a vast biological saga extending across many millions of years, and to be completely cute. Perhaps best of all – and let it not go unmentioned – anyone can make them.
———————
Bio: Rachel Rodman has a Ph.D. in Arabidopsis genetics and presently aspires to recast all of art, literature, and popular culture in the form of a phylogenetic tree.